What you can, can’t and shouldn’t do with social media data

Earlier this summer, I gave a talk on the promise & pitfalls of social media data for the Joint Statistical Meetings. While I don’t think there’s a recording of the talk, enough people asked for one that I figured it would be worth putting together a blog post version of the talk. Enjoy!


What you can do with social media data

Let’s start with the good news: research using social media data has revolutionized social science research. It’s let us ask bigger question more quickly, helped us overcome some of the key drawbacks of behavioral experimental work and ask new kinds of questions.

More data faster

I can’t overstate how revolutionary the easy availability of social media data has been, especially in linguistics. It has increased both the rate and scale of data collection by orders of magnitude. Compare the time it took to compare the Dictionary of American Regional English (DARE) to the Wordmapper app below. The results are more or less the same, maps of where in the US folks use different words (in this example, “cellar”). But what once took the entire careers of multiple researchers can now be done in a few months, and with far higher resolution.

Dictionary of American Regional English (DARE) Word Mapper App
Data collection 48 years (1965 – 2013) <1 year
Size of team 2,777 people 4 people
Number of participants 1,843 people 20 million
DARE map Wordmapper Map

Social networks

Social media sites with a following or friend feature also let us ask really large scale questions about social networks. How do social networks and political affiliation interact? How does language change move through a social network? What characteristics of social network structure are more closely associated with the spread of misinformation? Of course, we could ask these questions before social media data… but by using APIs to access social media data, we reduce the timescale of these projects from decades to weeks or even days and we have a clear way to operationalize social network ties. It’s fairly hard for someone to sit down and list everyone they interact with face-to-face, but it’s very easy to grab a list of all the Twitter accounts you follow.

Wild-caught, all natural data

One of the constant struggles in experimental work is the fact that the mere fact of being observed changes behavior. This is known as the Hawthorne Effect in psychology or the Observer’s Paradox in sociolinguistics. As a result, even the most well-designed experiment is limited by the fact that the participants know that they are completing an experiment.

Social media data, however, doesn’t have this limitation. Since most social media research projects are conducted on public data without interacting directly with participants, they are not generally considered human subjects research. When you post something on a public social media account, you don’t have a reasonable expectation of privacy. In other words, you know that just anyone could come along and read it, and that includes researchers. As a result it is not generally necessary to collect informed consent for social media projects. (Informed consent is when you are told exactly what’s going to happen during an experiment you’re participating, and you agree to participate in it.) This means that the vast majority of folks who are participating in a social media study don’t actually know that they’re part of a study.

The benefit of this is that it allows researchers to get around three common confounds that plague social science research:

  • Bradley effect: People tend to tell researchers what they think they want to hear
  • Response bias: The sample of people willing to do an experiment/survey differ in a meaningful way from the population as a whole
  • Observer’s paradox/Hawthorne effect: People change their behavior when they know they’re being observed

While this is a boon to researchers, the lack of informed consent does introduce other other problems, which we’ll talk about later.

What you can’t do with social media data

Of course, all the benefits of social media come at a cost. There are several key drawbacks and limitations of social media research:

  • You can’t be sure who your participants are.
  • There’s inherent sampling bias.
  • You can’t violate the developer’s agreements.

You’re not sure who you’re studying…

Because you don’t meet with the people whose data is included in your study, you don’t know for sure what sorts of demographic categories they belong to, whether they are who they’re claiming to be or even if they’re human at all. You have to deal with both bots, accounts where content is produced and distributed automatically by a computer and sock puppets, where one person pretends to be another person. Sock puppets in particular can be very difficult to spot and may skew your results in unpredictable ways.

…but you can be sure your sample is biased.

Social media users aren’t randomly drawn from the world’s population as a whole. Social media users tend to be WEIRD: from wealthy, educated, industrialized, rich and democratic societies. This group is already over-represented in social science and psychology research studies, which may be subtly skewing our models of human behavior.

In addition, different social media platforms have different user bases. For example, Instagram and Snapchat tend to have younger users, Pinterest has more women (especially compared to Reddit, which skews male) and LinkedIn users tend to be highly educated and upper middle class. And that doesn’t even get to social network effects: you’re more likely to be on the same platform your friends are on, and since social networks tend to be homophilous, you can end up with pockets of very socially homogeneous folks. So, even if you manage to sample randomly from a social media platform, your sample is likely to differ from one taken from the population as a whole.

You need to abide by the developer’s agreements for whatever platform you’re using data from.

This is mainly an issue if you’re using API (application programmatic interface) to fetch data from a service. Developer’s agreements vary between platforms, but most limit the amount of data you can fetch and store, and how and if you can share it with other researchers. For example, if you’re sharing Twitter data you can only share 50,000 tweets at a time and even then only if you have to have people download a file by clicking on it. If you share any more than that, you should just share the ID’s of the tweets rather than the full tweets. (Document the Now’s Hydrator can help you fetch the tweets associated with a set of IDs.)

What you shouldn’t do with social media data

Finally, there are ethical restrictions on what we should do with social media data. As researchers, we need to 1) respect the wishes of users and 2) safeguard their best interests, especially given that we don’t (currently) generally get informed consent from the folks whose data we’re collecting.

Respecting users’ wishes

At least in the US, ethical human subjects research is led by three guiding principles set forth in the Belmont report. If you’re unfamiliar with the report, it was written in the aftermath of the Tuskegee Valley experiments. These were a series of medical experiments on African Americans men who had contracted syphilis conducted from the 1930’s to 1970’s. During the study, researchers withheld the cure (and even information that it existed) from the participants. The study directly resulted in the preventable deaths of 128 men and many health problems for study participants, their wives and children. It was a clear ethical violation of the human rights of participants and the moral stain of it continues to shape how we conduct human subjects research in the US.

The three principles of ethical human subjects research are:

  1. Respect for Persons: People should be treated as autonomous individuals and persons with diminished autonomy (like children or prisoners) are entitled to protection.
  2. Beneficence: 1) Do not harm and 2) maximize possible benefits and minimize possible harms.
  3. Justice: Both the risks and benefits of research should be distributed equally.

Social media research might not technically fall under the heading of human subjects research, since we aren’t intervening with our participants. However, I still believe that it’s important that researchers following these general guides when designing and distributing experiments.

One thing we can do is respect their wishes of the communities we study. Fortunately, we have some evidence of what those wishes are. Feisler and Proferes (2018) surveyed 368 Twitter users on their perception of a variety of research behaviors.

Screenshot from 2018-07-25 16-10-21
Fiesler, C., & Proferes, N. (2018). “Participant” Perceptions of Twitter Research Ethics. Social Media+ Society, 4(1), 2056305118763366. Table 4. 

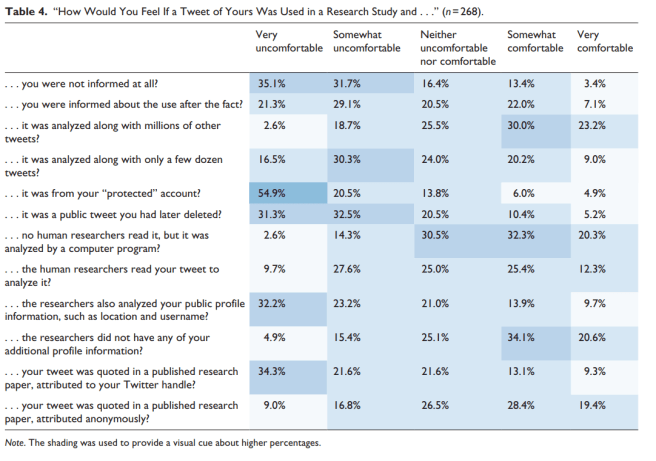
In general, Twitter users are more OK with research with the following characteristics:

  • Large datasets
  • Analyzed automatically
  • Social media users informed about research
  • If tweets are quoted, they are anonymized. (Note that if you include the exact text, it’s possible to reverse search the quoted tweet and de-anonymize it. I recommend changing at least 20% of the content words in a tweet to synonyms to get around this and double-checking by trying to de-anonymize it yourself.)

These characteristics, however, are not as acceptable to Twitter users:

  • Small datasets
  • Analysis done by hand (presumably including analysis by Mechanical Turk workers)
  • Tweets from protected accounts or deleted tweets analyzed (which is also against the developer’s agreement, so you shouldn’t be doing this anyway)
  • Quoting with citation (very different from academic norms!)

In general, I think these suggest general best practices for researchers working with Twitter data.

  • Stick to larger datasets
  • Try to automate wherever possible
  • Follow the developer’s agreement
  • Take anonymity seriously.

There is one thing I disagree with, however: I don’t think we should contact everyone who’s tweets we use in our research.

Should we contact people whose tweets we use in our studies? My gut instinct on this one is “no”. If you’re collecting a large amount of data, you probably shouldn’t reach out to everyone in the data.

For users who don’t have open DM’s, the only way to contact them is to publicly mention them using @username. The problem with this is that it partly de-anonymizes your data. If you then choose to share your data, having publicly shared a list of whose data was included in the dataset it makes it much easier to de-anonymize. Instead of trying to figure out whose tweets were included when looking at all of Twitter, an adversary only has to figure out which of the users on the list you’ve given them is connected to which record.

The main exception to this is if have a project that’s a deep dive on one user, in which case you probably should. (For example, I contacted Chaz Smith and let him know about my phonological analysis of his #pronouncingthingsincorrectly Vines.)

Do no harm

Another aspect of ethical research is trying to ensure that your research or research data doesn’t have potentially unethical applications. The elephant in the room here, of course, is the data Cambridge Analytica collected from Facebook users. Researchers at Cambridge, collecting data for a research project, got lots of people’s permission to access their Facebook data. While that wasn’t a problem, they collected and saved Facebook data from other folks as well, who hadn’t opted in. In the end, only a half of a half of a percent of the folks whose data was in the final dataset actually agreed to be included in it. To make matters worse, this data was used by a commercial company founded by one of the researchers to (possibly) influence elections in the US and UK. Here’s a New York Times article that goes into much more detail. This has understandably lead to increased scrutiny of how social media research data is collected and used.

I’m not bringing this up to call out Facebook in particular, but to explain why it’s important to consider how research data might be used long-term. How and where will it be stored? For how long? Who will have access to it? In short, if you’re a researcher, how can you ensure that data you collected won’t end up somehow hurting the people you collected it from?

As an example of how important these questions are, consider this OK Cupid “research” dataset. It was collected without consent and shared publicly without anonymization. It included many personal details that were only intended to be shared with other users of the site, including explicit statements of sexual orientation. In addition to being an unforgivable breach of privacy, this directly endangered users whose data was collected: information on sexual orientation was shared for people living in countries where homosexuality is a crime that carries a death penalty or sentence of life in prison. I have a lot of other issues with this “study” as well, but the fact that it directly endangered research subjects who had no chance to opt out is by far the most egregious ethical breach.

If you are collecting social media data for research purposes, it is your ethical responsibility to safeguard the well-being of the people whose data you’re using.

I bring up these cautionary tales not to scare you off of social media research but to really impress the gravity of the responsibility you carry as a social media researcher. Social media data has the potential to dramatically improve our understanding of the world. A lot of my own work has relied heavily on it! But it’s important that we, as researchers, take our moral duty to make sure that we don’t end up doing more harm than good very seriously.

Are emoji sequences as informative as text?

Something I’ve been thinking about a lot lately is how much information we really convey with emoji. I was recently at the 1​st​ International Workshop on Emoji Understanding and Applications in Social Media and one theme that stood out to me from the papers was that emoji tend to be used more to communicate social meaning (things like tone and when a conversation is over) than semantics (content stuff like “this is a dog” or “an icecream truck”).

I’ve been itching to apply an information theoretic approach to emoji use for a while, and this seemed like the perfect opportunity. Information theory is the study of storing, transmitting and, most importantly for this project, quantifying information. In other words, using an information theoretic approach we can actually look at two input texts and figure out which one has more information in it. And that’s just what we’re going to do: we’re going to use a measure called “entropy” to directly compare the amount of information in text and emoji.

What’s entropy?

Shannon entropy is a measure of how much information there is in a sequence. Higher entropy means that there’s more uncertainty about what comes next, while lower entropy means there’s less uncertainty.  (Mathematically, entropy is always less than or the same as log2(n), where n is the total number of unique characters. You can learn more about calculating entropy and play around with an interactive calculator here if you’re curious.)

So if you have a string of text that’s just one character repeated over and over (like this: 💀💀💀💀💀) you don’t need a lot of extra information to know what the next character will be: it will always be the same thing. So the string “💀💀💀💀💀” has a very low entropy. In this case it’s actually 0, which means that if you’re going through the string and predicting what comes next, you’re always going to be able to guess what comes next becuase it’s always the same thing. On the other hand, if you have a string that’s made up of four different characters, all of which are equally probable (like this:♢♡♧♤♡♧♤♢), then you’ll have an entropy of 2.

TL;DR: The higher the entropy of a string the more information is in it.

Experiment

Hypothesis

We do have some theoretical maximums for the entropy text and emoji. For text, if the text string is just randomly drawn from the 128 ASCII characters (which isn’t how language works, but this is just an approximation) our entropy would be 7. On the other hand, for emoji, if people are just randomly using any emoji they like from the set of emoji as of June 2017, then we’d expect to see an entropy of around 11.

So if people are just  using letters or emoji randomly, then text should have lower entropy than emoji. However, I don’t think that’s what’s happening. My hypothesis, based on the amount of repetition in emoji, was that emoji should have lower entropy, i.e. less information, than text.

Data

To get emoji and text spans for our experiment I used four different datasets: three from Twitter and one from YouTube.

I used multiple datasets for a couple reasons. First, becuase I wanted a really large dataset of tweets with emoji, and since only between 0.9% and 0.5% of tweets from each Twitter dataset actually contained emoji I needed to case a wide net. And, second, because I’m growing increasingly concerned about genre effects in NLP research. (Like, a lot of our research is on Twitter data. Which is fine, but I’m worried that we’re narrowing the potential applications of our research becuase of it.) It’s the second reason that led me to include YouTube data. I used Twitter data for my initial exploration and then used the YouTube data to validate my findings.

For each dataset, I grabbed all adjacent emoji from a tweet and stored them separately. So this tweet:

Love going to ballgames! ⚾🌭 Going home to work in my garden now, tho 🌸🌸🌸🌸

Has two spans in it:

Span 1:  ⚾🌭

Span 2: 🌸🌸🌸🌸

All told, I ended up with 13,825 tweets with emoji and 18,717 emoji spans of which only 4,713 were longer than one emoji. (I ignored all the emoji spans of length one, since they’ll always have an entropy of 0 and aren’t that interesting to me.) For the YouTube comments, I ended up with 88,629 comments with emoji, 115,707 emoji spans and 47,138 spans with a length greater than one.

In order to look at text as parallel as possible to my emoji spans, I grabbed tweets & YouTube comments without emoji. For each genre, I took a number of texts equal to the number of spans of length > 1 and then calculated the character-level entropy for the emoji spans and the texts.


Analysis

First, let’s look at Tweets. Here’s the density (it’s like a smooth histogram, where the area under the curve is always equal to 1 for each group) of the entropy of an equivalent number of emoji spans and tweets.

download (6)
Text has a much high character-level entropy than emoji. For text, the mean and median entropy are both around 5. For emoji, there is a multimodal distribution, with the median entropy being 0 and also clusters around 1 and 1.5.

It looks like my hypothesis was right! At least in tweets, text has much more information than emoji. In fact, the most common entropy for an emoji span is 0: which means that most emoji spans with a length greater than one are just repititons of the same emoji over and over again.

But is this just true on Twitter, or does it extend to YouTube comments as well?

download (5)
The pattern for emoji & text in YouTube comments is very similar to that for Tweets. The biggest difference is that it looks like there’s less information in YouTube Comments that are text-based; they have a mean and median entropy closer to 4 than 5.

The YouTube data, which we have almost ten times more of, corroborates the earlier finding: emoji spans are less informative, and more repetitive, than text.

Which emoji were repeated the most/least often?

Just in case you were wondering, the emoji most likely to be repeated was the skull emoji, 💀. It’s generally used to convey strong negative emotion, especially embarrassment, awkwardness or speechlessness, similar to “ded“.

The least likely was the right-pointing arrow (▶️), which is usually used in front of links to videos.

More info & further work

If you’re interested, the code for my analysis is available here. I also did some of this work as live coding, which you can follow along with on YouTube here.

For future work, I’m planning on looking at which kinds of emoji are more likely to be repeated. My intuition is that gestural emoji (so anything with a hand or face) are more likely to be repeated than other types of emoji–which would definitely add some fuel to the “are emoji words or gestures” debate!

How do we use emoji?

Those of you who know me may know that I’m a big fan of emoji. I’m also a big fan of linguistics and NLP, so, naturally, I’m very curious about the linguistic roles of emoji. Since I figured some of you might also be curious, I’ve pulled together a discussion of some of the very serious scholarly research on emoji. In particular, I’m going to talk about five recent papers that explore the exact linguistic nature of these symbols: what are they and how do we use them?

Twemoji2 1f913
Emoji are more than just cute pictures! They play a set of very specific linguistic roles.

Dürscheid & Siever, 2017:

This paper makes one overarching point: emoji are not words. They cannot be unambiguously interpreted without supporting text and they do not have clear syntactic relationships to one another. Rather, the authors consider emoji to be specialized characters, and place them within Gallmann’s 1985 hierarchy of graphical signs. The authors show that emoji can play a range of roles within the Gallmann’s functional classification.

  • Allography: using emoji to replace specific characters (for example: the word “emoji” written as “em😝ji”)
  • Ideograms: using emoji to replace a specific word (example: “I’m travelling by 🚘” to mean “I’m travelling by car”)
  • Border and Sentence Intention signals: using emoji both to clarify the tone of the preceding sentence and also to show that the sentence is over, often replacing the final punctuation marks.

Based on an analysis of a Swiss German Whatsapp corpus, the authors conclude that the final category is far and away the most popular, and that emoji rarely replace any part of the lexical parts of a message.

Na’aman et al, 2017:

Na’aman and co-authors also develop a hierarchy of emoji usage, with three top-level categories: Function, Content (both of which would fall under mostly under the ideogram category in Dürscheid & Siever’s classifications) and Multimodal.

  • Function: Emoji replacing function words, including prepositions, auxiliary verbs, conjunctions, determinatives and punctuation. An example of this category would be “I like 🍩 you”, to be read as “I do not like you”.
  • Content: Emoji replacing content words and phrases, including nouns, verbs, adjectives and adverbs. An example of this would be “The 🔑 to success”, to be read as “the key to success”.
  • Multimodal: These emoji “enrich a grammatically-complete text with markers of
    affect or stance”. These would fall under the category of border signals in Dürscheid & Siever’s framework, but Na’aman et all further divide these into four categories: attitude, topic, gesture and other.

Based on analysis of a Twitter corpus made of up of only tweets containing emoji, the authors find that multimodal emoji encoding attitude are far and away the most common, making up over 50% of the emoji spans in their corpus. The next most common uses of emoji are to multimodal:topic and multimodal:gesture. Together, these three categories account for close to 90% of the all the emoji use in the corpus, corroborating the findings of Dürscheid & Siever.

Wood & Ruder, 2016:

Wood and Ruder provide further evidence that emoji are used to express emotion (or “attitude”, in Na’aman et al’s terms). They found a strong correlation between the presence of emoji that they had previously determined were associated with a particular emotion, like 😂 for joy or 😭 for sadness, and human annotations of the emotion expressed in those tweets. In addition, an emotion classifier using only emoji as input performed similarly to one trained using n-grams excluding emoji. This provides evidence that there is an established relationship between specific emoji use and expressing emotion.

Donato & Paggio, 2017:

However, the relationship between text and emoji may not always be so close. Donato & Paggio collected a corpus of tweets which contained at least one emoji and that were hand-annotated for whether the emoji was redundant given the text of the tweet.  For example, “We’ll always have Beer. I’ll see to it. I got your back on that one. 🍺” would be redundant, while “Hopin for the best 🎓” would not be, since the beer emoji expresses content already expressed in the tweet, while the motorboard adds new information (that the person is hoping to graduate, perhaps). The majority of emoji, close to 60%, were found not to be redundant and added new information to the tweet.

However, the corpus was intentionally balanced between ten topic areas, of which only one was feelings, and as a result the majority of feeling-related tweets were excluded from analysis. Based on this analysis and Wood and Ruder’s work, we might hypothesize that feelings-related emoji may be more redundant than other emoji from other semantic categories.

Barbieri et al, 2017:

Additional evidence for the idea that emoji, especially those that show emotion, are predictable given the text surrounding them comes from Barbieri et al. In their task, they removed the emoji from a thousand tweets that contained one of the following five emoji: 😂, ❤️, 😍, 💯 or 🔥. These emoji were selected since they were the most common in the larger dataset of half a million tweets. Then then asked human crowd workers to fill in the missing emoji given the text of the tweet, and trained a character-level bidirectional LSTM to do the same task. Both humans and the LSTM performed well over chance, with an F1 score of 0.50 for the humans and 0.65 for the LSTM.


So that was a lot of papers and results I just threw at you. What’s the big picture? There are two main points I want you to take away from this post:

  • People mostly use emoji to express emotion. You’ll see people playing around more than that, sure, but by far the most common use is to make sure people know what emotion you’re expressing with a specific message.
  • Emoji, particularly emoji that are used to represent emotions, are predictable given the text of the message. It’s pretty rare for us to actually use emoji to introduce new information, and we generally only do that when we’re using emoji that have a specific, transparent meaning.

If you’re interested in reading more, here are all the papers I mentioned in this post:

Bibliography:

Barbieri, F., Ballesteros, M., & Saggion, H. (2017). Are Emojis Predictable? EACL.

Donato, G., & Paggio, P. (2017). Investigating Redundancy in Emoji Use: Study on a Twitter Based Corpus. In Proceedings of the 8th Workshop on Computational Approaches to Subjectivity, Sentiment and Social Media Analysis (pp. 118-126).

Dürscheid, C., & Siever, C. M. (2017). Beyond the Alphabet–Communication of Emojis. Kurzfassung eines (auf Deutsch) zur Publikation eingereichten Manuskripts.

Gallmann, P. (1985). Graphische Elemente der geschriebenen Sprache. Grundlagen für eine Reform der Orthographie. Tübingen: Niemeyer.

Na’aman, N., Provenza, H., & Montoya, O. (2017). Varying Linguistic Purposes of Emoji in (Twitter) Context. In Proceedings of ACL 2017, Student Research Workshop (pp. 136-141).

Wood, I. & Ruder, S. (2016). Emoji as Emotion Tags for Tweets. Sánchez-Rada, J. F., & Schuller, B (Eds.). In Proceedings of LREC 2016, Workshop on Emotion and Sentiment Analysis (pp. 76-80).

Parity in Utility: One way to think about fairness in machine learning tools

First, a confession: part of the reason I’m writing this blog post today is becuase I’m having major FOMO on account of having missed #FAT2018, the first annual Conference on Fairness, Accountability, and Transparency. (You can get the proceedings online here, though!) I have been seeing a lot of tweets & good discussion around the conference and it’s gotten me thinking again about something I’ve been chewing on for a while: what does it mean for a machine learning tool to be fair?

If you’re not familiar with the literature, this recent paper by Friedler et al is a really good introduction, although it’s not intended as a review paper. I also review some of it in these slides. Once you’ve dug into the work a little bit, you may notice that a lot of this work is focused on examples where output of the algorithm is a decision made on the level of the individual: Does this person get a loan or not? Should this resume be passed on to a human recruiter? Should this person receive parole?

M. Vitrvvii Pollionis De architectvra libri decem, ad Caes. Avgvstvm, omnibus omnium editionibus longè emendatiores, collatis veteribus exemplis (1586) (14597168680)
Fairness is a balancing act.

While these are deeply important issues, the methods developed to address fairness in these contexts don’t necessarily translate well to evaluating fairness for other applications. I’m thinking specifically about tools like speech recognition or facial recognition for automatic focusing in computer vision: applications where an automatic tool is designed to supplant or augment some sort of human labor. The stakes are lower in these types of applications, but it’s still important that they don’t unintentionally end up working poorly for certain groups of people. This is what I’m calling “parity of utility”.

Parity of utility: A machine learning application which automatically completes a task using human data should not preform reliably worse for members of one or more social groups relevant to the task.

That’s a bit much to throw at you all at once, so let me break down my thinking a little bit more.

  • Machine learning application: This could be a specific algorithm or model, an ensemble of multiple different models working together, or an entire pipeline from data collection to the final output. I’m being intentionally vague here so that this definition can be broadly useful.
  • Automatically completes a task: Again, I’m being intentionally vague here. By “a task” I mean some sort of automated decision based on some input stimulus, especially classification or recognition.
  • Human data: This definition of fairness is based on social groups and is thus restricted to humans. While it may be frustrating that your image labeler is better at recognizing cows than horses, it’s not unfair to horses becuase they’re not the ones using the system. (And, arguably, becuase horses have no sense of fairness.)
  • Preform reliably worse: Personally I find a statistically significant difference in performance between groups with a large effect size to be convincing evidence. There are other ways of quantifying difference, like the odds ratio or even the raw accuracy across groups, that may be more suitable depending on your task and standards of evidence.
  • Social groups relevant to the task: This particular fairness framework is concerned with groups rather than individuals. Which groups? That depends. Not every social group is going to relevant to every task. For instance, your mother language(s) is very relevant for NLP applications, while it’s only important for things like facial recognition in as far as it co-varies with other, visible demographic factors. Which social groups are relevant for what types of human behavior is, thankfully, very well studied, especially in sociology.

So how can we turn these very nice-sounding words into numbers? The specifics will depend on your particular task, but here are some examples:

So the tools reviewed in these papers don’t demonstrate parity of utility: they work better for folks from specific groups and worse for folks from other groups. (And, not co-incidentally, when we find that systems don’t have parity in utility, they tend work best for more privileged groups and worse for less privileged groups.)

Parity of Utility vs. Overall Performance

So this is the bit where things get a bit complicated: parity of utility is one way to evaluate a system, but it’s a measure of fairness, not overall system performance. Ideally, a high-performing system should also be a fair system and preform well for all groups. But what if you have a situation where you need to choose between prioritizing a fairer system or one with overall higher performance?

I can’t say that one goal is unilaterally better than the other in all situations. What I can say is that focusing on only higher performance and not investigating measures of fairness we risk building systems that have systematically lower performance for some groups. In other words, we can think of an unfair system (under this framework) as one that is overfit to one or more social groups. And, personally, I consider a model overfit to a specific social group while being intended for general use to be flawed.


Parity of Utility is an idea I’ve been kicking around for a while, but it could definitely use some additional polish and wheel-kicking, so feel free to chime in in the comments. I’m especially interested in getting some other perspectives on these questions:

  1. Do you agree that a tool that has parity in utility is “fair”?
  2. What would you need to add (or remove) to have a framework that you would consider fair?
  3. What do you consider an acceptable balance of fairness and overall performance?
  4. Would you prefer to create an unfair system with slightly higher overall performance or a fair system with slightly lower overall performance? Which type of system would you prefer to be a user of? What about if a group you are a member of had reliably lower performance?
  5. Is it more important to ensure that some groups are treated fairly? What about a group that might need a tool for accessibility rather than just convenience?

How well do Google and Microsoft and recognize speech across dialect, gender and race?

If you’ve been following my blog for a while, you may remember that last year I found that YouTube’s automatic captions didn’t work as well for some dialects, or for women. The effects I found were pretty robust, but I wanted to replicate them for a couple of reasons:

  • I only looked at one system, YouTube’s automatic captions, and even that was over a period of several years instead of at just one point in time. I controlled for time-of-upload in my statistical models, but it wasn’t the fairest system evaluation.
  • I didn’t control for the audio quality, and since speech recognition is pretty sensitive to things like background noise and microphone quality, that could have had an effect.
  • The only demographic information I had was where someone was from. Given recent results that find that natural language processing tools don’t work as well for African American English, I was especially interested in looking at automatic speech recognition (ASR) accuracy for African American English speakers.

With that in mind, I did a second analysis on both YouTube’s automatic captions and Bing’s speech API (that’s the same tech that’s inside Microsoft’s Cortana, as far as I know).

Speech Data

For this project, I used speech data from the International Dialects of English Archive. It’s a collection of English speech from all over, originally collected to help actors sound more realistic.

I used speech data from four varieties: the South (speakers from Alabama), the Northern Cities (Michigan), California (California) and General American. “General American” is the sort of news-caster style of speech that a lot of people consider unaccented–even though it’s just as much an accent as any of the others! You can hear a sample here.

For each variety, I did an acoustic analysis to make sure that speakers I’d selected actually did use the variety I thought they should, and they all did.

Systems

For the YouTube captions, I just uploaded the speech files to YouTube as videos and then downloaded the subtitles. (I would have used the API instead, but when I was doing this analysis there was no Python Google Speech API, even though very thorough documentation had already been released.)

Bing’s speech API was a little  more complex. For this one, my co-author built a custom Android application that sent the files to the API & requested a long-form transcript back. For some reason, a lot of our sound files were returned as only partial transcriptions. My theory is that there is a running confidence function for the accuracy of the transcription, and once the overall confidence drops below a certain threshold, you get back whatever was transcribed up to there. I don’t know if that’s the case, though, since I don’t have access to their source code. Whatever the reason, the Bing transcriptions were less accurate overall than the YouTube transcriptions, even when we account for the fact that fewer words were returned.

Results

OK, now to the results. Let’s start with dialect area. As you might be able to tell from the graphs below, there were pretty big differences between the two systems we looked at. In general, there was more variation in the word error rate for Bing and overall the error rate tended to be a bit higher (although that could be due to the incomplete transcriptions we mentioned above). YouTube’s captions were generally more accurate and more consistent. That said, both systems had different error rates across dialects, with the lowest average error rates for General American English.

dialect
Differences in Word Error Rate (WER) by dialect were not robust enough to be significant for Bing (under a one way ANOVA) (F[3, 32] = 1.6, p = 0.21), but they were for YouTube’s automatic captions (F[3, 35] = 3.45,p < 0.05). Both systems had the lowest average WER for General American.
Now, let’s turn to gender. If you read my earlier work, you’ll know that I previously found that YouTube’s automatic captions were more accurate for men and less accurate for women. This time, with carefully recorded speech samples, I found no robust difference in accuracy by gender in either system. Which is great! In addition, the unreliable trends for each system pointed in opposite ways; Bing had a lower WER for male speakers, while YouTube had a lower WER for female speakers.

So why did I find an effect last time? My (untested) hypothesis is that there was a difference in the signal to noise ratio for male and female speakers in the user-uploaded files. Since women are (on average) smaller and thus (on average) slightly quieter when they speak, it’s possible that their speech was more easily masked by background noises, like fans or traffic. These files were all recorded in a quiet place, however, which may help to explain the lack of difference between genders.

gender
Neither Bing (F[1, 34] = 1.13, p = 0.29), nor YouTube’s automatic captions (F[1, 37] = 1.56, p = 0.22) had a significant difference in accuracy by gender.
Finally, what about race? For this part of the analysis, I excluded General American speakers, since they did not report their race. I also excluded the single Native American speaker. Even with fewer speakers, and thus reduced power, the differences between races were still robust enough to be significant for YouTube’s automatic captions and Bing followed the same trend. Both systems were most accurate for Caucasian speakers.

ethnicity
As with dialect, differences in WER between races were not significant for Bing (F[4, 31] = 1.21, p = 0.36), but were significant for YouTube’s automatic captions (F[4, 34] = 2.86,p< 0.05). Both systems were most accurate for Caucasian speakers.
While I was happy to find no difference in performance by gender, the fact that both systems made more errors on non-Caucasian and non-General-American speaking talkers is deeply concerning. Regional varieties of American English and African American English are both consistent and well-documented. There is nothing intrinsic to these varieties that make them less easy to recognize. The fact that they are recognized with more errors is most likely due to bias in the training data. (In fact, Mozilla is currently collecting diverse speech samples for an open corpus of training data–you can help them out yourself.)

So what? Why does word error rate matter?

There are two things I’m really worried about with these types of speech recognition errors. The first is higher error rates seem to overwhelmingly affect already-disadvantaged groups. In the US, strong regional dialects tend to be associated with speakers who aren’t as wealthy, and there is a long and continuing history of racial discrimination in the United States.

Given this, the second thing I’m worried about is the fact that these voice recognition systems are being incorporated into other applications that have a real impact on people’s lives.

Every automatic speech recognition system makes errors. I don’t think that’s going to change (certainly not in my lifetime). But I do think we can get to the point where those error don’t disproportionately affect already-marginalized people. And if we keep using automatic speech recognition into high-stakes situations it’s vital that we get to that point quickly and, in the meantime, stay aware of these biases.

If you’re interested in the long version, you can check out the published paper here.

Can a computer write my blog posts?

This post is pretty special: it’s the 100th post I’ve made since starting my blog! It’s hard to believe I’ve been doing this so long. I started blogging in 2012, in my final year of undergrad, and now I’m heading into my last year of my PhD. Crazy how fast time flies.

Ok, back on topic. As I was looking back over everything I’ve written, it struck me that 99 posts worth of text on a very specific subject domain (linguistics) in a very specific register (informal) should be enough text to train a simple text generator.

Bios robotlab writing robot
Linguisitics is… fun… and… cool. How am I doing so far?
So how did I go about building a blog bot? It was pretty easy! All I needed was:

  • 67,000 words of text (all blog posts before this one)
  • 1 R script to tidy up the text
  • 1 Python script to train a Markov Chain  text generator

A Markov Whatnow?

A Markov Chain is a type of simple (but surprisingly powerful) statistical model that tells you, given the item you’re currently on, what item you’re likely to see next. Today we’re going to apply it to whole words in a text.

How does it work? Basically, for each word in your text, you count how many different words occur after it, how many time each shows up and figure out the probability of each transition. So if your text is “The dog ate the apple.”, then there’s a 50% chance that “the” will be followed by “apple”, but a 100% chance that “apple” will be followed by “.”. You can then use these probabilities to generate new sentences, like so:

  • Input: The dog ate the apple.
  • Possible outputs:
    • The apple.
    • The dog ate the apple.
    • The dog ate the dog ate the apple.
    • The dog ate the dog ate the dog ate the dog ate the dog ate the dog ate the dog ate the dog ate the dog ate the dog ate the dog ate the apple. (This may seem silly, but remember that we’re only looking at two words at a time. This model doesn’t “remember” what came earlier or “know” that it’s repeating itself.)

OK, now for the actual training of the model. If you want to play around with this yourself, all my code and text is up on GitHub here.

  1. First, grab your text. I downloaded all my blog posts as an XML file and used a quick little R script to snag just the text I was interested in.
  2. Next, train your model. I used PyMarkovChain, but you can always write your own if you’re feeling it.
  3. Finally, use the model to generate text.

Alright, now I’ve got (admittedly very, very dumb) little program that kinda knows what I write like when I’m blogging. How well does it do at pretending to be me?

First try:

I’m going to break eye contact, look down at your own personalized ASR system

Well that’s… vaguely disturbing. But also not really very human-sounding, and certainly not something I’d write in a blog post. Let’s give it a couple more tries and see if it does any better.

  • But, if frosting has to have a career where you learned it from Clarice
  • We only perceive the things that our bodies and sensory organs and brains can perceive, and we really don’t care about to tell the sounds in the second part, I was expecting to see whether something is grammatical is to put up a bunch of historical stuff that we’ve all heard about the structure in the arts and sciences were depressed
  • (Which is really interesting–I’d love to learn your language doesn’t make you very, very good a recognizing speech
  • Believe me, I know what you can uncontract them and what’s the take-away
    People with short face syndrome–yes, that’s a classical description of what a language does, along with parallels drawn to another, related, languages
  • Short answer: they’re all correct
  • And those speakers are aware of
  • The Job Market for Linguistics PhDsWhat do you much

Hmm, not so great. The only output that sounded good to me was “Short answer: they’re all correct”. And that was just the exact same phrasing I used in this blog post. No wonder it sounds just like me; it is me!

So it looks like I won’t be handing the reins over to Making Noise and Hearing Things bot any time soon. True, I could have used a fancier tool, like a Recurrent Neural Network. But to be perfectly honest, I have yet to see any text generation system that can produce anything even close to approximating a human-written blog post. Will we get there? Maybe. But natural language generation, especially outside of really formulaic things like weather or sports reporting, is a super hard problem. Heck, we still haven’t gotten to point where computers can reliably solve third-grade math word problems.

The very complexities that make language so useful (and interesting to study) also make it so hard to model. Which is good news for me! It means there’s still plenty of work to do in language modelling and blogging.

Meme Grammar

So the goal of linguistics is to find and describe the systematic ways in which humans use language. And boy howdy do we humans love using language systematically. A great example of this is internet memes.

What are internet memes? Well, let’s start with the idea of a “meme”. “Memes” were posited by Richard Dawkin in his book The Selfish Gene. He used the term to describe cultural ideas that are transmitted from individual to individual much like a virus or bacteria. The science mystique I’ve written about is a great example of a meme of this type. If you have fifteen minutes, I suggest Dan Dennett’s TED talk on the subject of memes as a much more thorough introduction.

So what about the internet part? Well, internet memes tend to be a bit narrower in their scope. Viral videos, for example, seem to be a separate category from intent memes even though they clearly fit into Dawkin’s idea of what a meme is. Generally, “internet meme” refers to a specific image and text that is associated with that image. These are generally called image macros. (For a through analysis of emerging and successful internet memes, as well as an excellent object lesson in why you shouldn’t scroll down to read the comments, I suggest Know Your Meme.) It’s the text that I’m particularly interested in here.

Memes which involve language require that it be used in a very specific way, and failure to obey these rules results in social consequences. In order to keep this post a manageable size, I’m just going to look at the use of language in the two most popular image memes, as ranked by memegenerator.net, though there is a lot more to study here. (I think a study of the differing uses of the initialisms MRW [my reaction when]  and MFW [my face when] on imgur and 4chan would show some very interesting patterns in the construction of identity in the two communities. Particularly since the 4chan community is made up of anonymous individuals and the imgur community is made up of named individuals who are attempting to gain status through points. But that’s a discussion for another day…)

The God tier (i.e. most popular) characters at on the website Meme Generator as of February 23rd, 2013. Click for link to site.
The God tier (i.e. most popular) characters at on the website Meme Generator as of February 23rd, 2013. Click for link to site. If you don’t recognize all of these characters, congratulations on not spending all your free time on the internet.

Without further ado, let’s get to the grammar. (I know y’all are excited.)

Y U No

This meme is particularly interesting because its page on Meme Generator already has a grammatical description.

The Y U No meme actually began as Y U No Guy but eventually evolved into simply Y U No, the phrase being generally followed by some often ridiculous suggestion. Originally, the face of Y U No guy was taken from Japanese cartoon Gantz’ Chapter 55: Naked King, edited, and placed on a pink wallpaper. The text for the item reads “I TXT U … Y U NO TXTBAK?!” It appeared as a Tumblr file, garnering over 10,000 likes and reblogs.

It went totally viral, and has morphed into hundreds of different forms with a similar theme. When it was uploaded to MemeGenerator in a format that was editable, it really took off. The formula used was : “(X, subject noun), [WH]Y [YO]U NO (Y, verb)?”[Bold mine.]

A pretty good try, but it can definitely be improved upon. There are always two distinct groupings of text in this meme, always in impact font, white with a black border and in all caps. This is pretty consistent across all image macros. In order to indicate the break between the two text chunks, I will use — throughout this post. The chunk of text that appears above the image is a noun phrase that directly addresses someone or something, often a famous individual or corporation. The bottom text starts with “Y U NO” and finishes with a verb phrase. The verb phrase is an activity or action that the addressee from the first block of text could or should have done, and that the meme creator considers positive. It is also inflected as if “Y U NO” were structurally equivalent to “Why didn’t you”. So, since you would ask Steve Jobs “Why didn’t you donate more money to charity?”, a grammatical meme to that effect would be “STEVE JOBS — Y U NO DONATE MORE MONEY TO CHARITY”. In effect, this meme questions someone or thing who had the agency to do something positive why they chose not to do that thing. While this certainly has the potential to be a vehicle for social commentary, like most memes it’s mostly used for comedic effect. Finally, there is some variation in the punctuation of this meme. While no punctuation is the most common, an exclamation points, a question mark or both are all used. I would hypothesize that the the use of punctuation varies between internet communities… but I don’t really have the time or space to get into that here.

A meme (created by me using Meme Generator) following the guidelines outlined above.

Futurama Fry

This meme also has a brief grammatical analysis

The text surrounding the meme picture, as with other memes, follows a set formula. This phrasal template goes as follows: “Not sure if (insert thing)”, with the bottom line then reading “or just (other thing)”. It was first utilized in another meme entitled “I see what you did there”, where Fry is shown in two panels, with the first one with him in a wide-eyed expression of surprise, and the second one with the familiar half-lidded expression.

As an example of the phrasal template, Futurama Fry can be seen saying: “Not sure if just smart …. Or British”. Another example would be “Not sure if highbeams … or just bright headlights”. The main form of the meme seems to be with the text “Not sure if trolling or just stupid”.

This meme is particularly interesting because there seems to an extremely rigid syntactic structure. The phrase follow the form “NOT SURE IF _____ — OR _____”. The first blank can either be filled by a complete sentence or a subject complement while the second blank must be filled by a subject complement. Subject complements, also called predicates (But only by linguists; if you learned about predicates in school it’s probably something different. A subject complement is more like a predicate adjective or predicate noun.), are everything that can come after a form of the verb “to be” in a sentence. So, in a sentence like “It is raining”, “raining” is the subject complement. So, for the Futurama Fry meme, if you wanted to indicate that you were uncertain whther it was raining or sleeting, both of these forms would be correct:

  • NOT SURE IF IT’S RAINING — OR SLEETING
  • NOT SURE IF RAINING — OR SLEETING

Note that, if a complete sentence is used and abbreviation is possible, it must be abbreviated. Thus the following sentence is not a good Futurama Fry sentence:

  • *NOT SURE IF IT IS RAINING — OR SLEETING

This is particularly interesting  because the “phrasal template” description does not include this distinction, but it is quite robust. This is a great example of how humans notice and perpetuate linguistic patterns that they aren’t necessarily aware of.

A meme (created by me using Meme Generator) following the guidelines outlined above. If you’re not sure whether it’s phonetics or phonology, may I recommend this post as a quick refresher?

So this is obviously very interesting to a linguist, since we’re really interested in extracting and distilling those patterns. But why is this useful/interesting to those of you who aren’t linguists? A couple of reasons.

  1. I hope you find it at least a little interesting and that it helps to enrich your knowledge of your experience as a human. Our capacity for patterning is so robust that it affects almost every aspect of our existence and yet it’s easy to forget that, to let our awareness of that slip our of our conscious minds. Some patterns deserve to be examined and criticized, though, and  linguistics provides an excellent low-risk training ground for that kind of analysis.
  2. If you are involved in internet communities I hope you can use this new knowledge to avoid the social consequences of violating meme grammars. These consequences can range from a gentle reprimand to mockery and scorn The gatekeepers of internet culture are many, vigilant and vicious.
  3. As with much linguistic inquiry, accurately noting and describing these patterns is the first step towards being able to use them in a useful way. I can think of many uses, for example, of a program that did large-scale sentiment analyses of image macros but was able to determine which were grammatical (and therefore more likely to be accepted and propagated by internet communities) and which were not.

Why is it so hard for computers to recognize speech?

This is a problem that’s plagued me for quite a while. I’m not a computational linguist  myself, but one of the reasons that theoretical linguistics is important is that it allows us to create robust concpetional models of language… which is basically what voice recognition (or synthesis) programs are. But, you may say to yourself, if it’s your job to create and test robust models, you’re clearly not doing very well. I mean, just listen to this guy. Or this guy. Or this person, whose patience in detailing errors borders on obsession. Or, heck, this person, who isn’t so sure that voice recognition is even a thing we need.

Electronic eye
You mean you wouldn’t want to be able to have pleasant little chats with your computer? I mean, how could that possibly go wrong?
Now, to be fair to linguists, we’ve kinda been out of the loop for a while. Fred Jelinek, a very famous researcher in speech recognition, once said “Every time we fire a phonetician/linguist, the performance of our system goes up”. Oof, right in the career prospects. There was, however, a very good reason for that, and it had to do with the pressures on computer scientists and linguists respectively. (Also a bunch of historical stuff that we’re not going to get into.)

Basically, in the past (and currently to a certain extent) there was this divide in linguistics. Linguists wanted to model speaker’s competence, not their performance. Basically, there’s this idea that there is some sort of place in your brain where you knew all the rules of language and  have them all perfectly mapped out and described. Not in a consious way, but there nonetheless. But somewhere between the magical garden of language and your mouth and/or ears you trip up and mistakes happen. You say a word wrong or mishear it or switch bits around… all sorts of things can go wrong. Plus, of course, even if we don’t make a recognizable mistake, there’s a incredible amount of variation that we can decipher without a problem. That got pushed over to the performance side, though, and wasn’t looked at as much. Linguistics was all about what was happening in the language mind-garden (the competence) and not the messy sorts of things you say in everyday life (the performance). You can also think of it like what celebrities actually say in an interview vs. what gets into the newspaper; all the “um”s and “uh”s are taken out, little stutters or repetitions are erased and if the sentence structure came out a little wonky the reporter pats it back into shape. It was pretty clear what they meant to say, after all.

So you’ve got linguists with their competence models explaining them to the computer folks and computer folks being all clever and mathy and coming up with algorithms that seem to accurately model our knowledge of human linguistic competency… and getting terrible results. Everyone’s working hard and doing their best and it’s just not working.

I think you can probably figure out why: if you’re a computer and just sitting there with very little knowledge of language (consider that this was before any of the big corpora were published, so there wasn’t a whole lot of raw data) and someone hands you a model that’s supposed to handle only perfect data and also actual speech data, which even under ideal conditions is far from perfect, you’re going to spit out spaghetti and call it a day. It’s a bit like telling someone to make you a peanut butter and jelly sandwich and just expecting them to do it. Which is fine if they already know what peanut butter and jelly are, and where you keep the bread, and how to open jars, and that food is something humans eat, so you shouldn’t rub it on anything too covered with bacteria or they’ll get sick and die. Probably not the best way to go about it.

So the linguists got the boot and they and the computational people pretty much did their own things for a bit. The model that most speech recognition programs use today is mostly statistical, based on things like how often a word shows up in whichever corpus they’re using currently. Which works pretty well. In a quiet room. When you speak clearly. And slowly. And don’t use any super-exotic words. And aren’t having a conversation. And have trained the system on your voice. And have enough processing power in whatever device you’re using. And don’t get all wild and crazy with your intonation. See the problem?

Language is incredibly complex and speech recognition technology, particularly when it’s based on a purely statistical model, is not terrific at dealing with all that complexity. Which is not to say that I’m knocking statistical models! Statistical phonology is mind-blowing and I think we in linguistics will get a lot of mileage from it. But there’s a difference. We’re not looking to conserve processing power: we’re looking to model what humans are actually doing. There’s been a shift away from the competency/performance divide (though it does still exist) and more interest in modelling the messy stuff that we actually see: conversational speech, connected speech, variation within speakers. And the models that we come up with are complex. Really complex. People working in Exemplar Theory, for example, have found quite a bit of evidence that you remember everything you’ve ever heard and use all of it to help parse incoming signals. Yeah, it’s crazy. And it’s not something that our current computers can do. Which is fine; it give linguists time to further refine our models. When computers are ready, we will be too, and in the meantime computer people and linguistic people are showing more and more overlap again, and using each other’s work more and more. And, you know, singing Kumbayah and roasting marshmallows together. It’s pretty friendly.

So what’s the take-away? Well, at least for the moment, in order to get speech recognition to a better place than it is now, we need  to build models that work for a system that is less complex than the human brain. Linguistics research, particularly into statistical models, is helping with this. For the future? We need to build systems that are as complex at the human brain. (Bonus: we’ll finally be able to test models of child language acquisition without doing deeply unethical things! Not that we would do deeply unethical things.) Overall, I’m very optimistic that computers will eventually be able to recognize speech as well as humans can.

TL;DR version:

  • Speech recognition has been light on linguists because they weren’t modeling what was useful for computational tasks.
  • Now linguists are building and testing useful models. Yay!
  • Language is super complex and treating it like it’s not will get you hit in the face with an error-ridden fish.
  • Linguists know language is complex and are working diligently at accurately describing how and why. Yay!
  • In order to get perfect speech recognition down, we’re going to need to have computers that are similar to our brains.
  • I’m pretty optimistic that this will happen.


Mapping language, language maps

So for some reason, I’ve come across three studies in quick succession based in mapping language. Now, if you know me, you know that nattering on about linguistic methodology is pretty much the Persian cat to my Blofeld, but I really do think that looking at the way that linguists do linguistics is incredibly important. (Warning: the next paragraph will be kinda preachy, feel free to skip it.)

It’s something the field, to paint with an incredibly broad brush, tends to skimp on. After all, we’re asking all these really interesting questions that have the potential to change people’s lives. How is hearing speech different from hearing other things? What causes language pathologies and how can we help correct them? Can we use the voice signal to reliably detect Parkinson’s over the phone? That’s what linguistics is. Who has time to look at whether asking  people to list the date on a survey form affects their responses? If linguists don’t use good, controlled methods to attempt to look at these questions, though, we’ll either find the wrong answers or miss it completely because of some confounding variable we didn’t think about. Believe me, I know firsthand how heart wrenching it is to design an experiment,  run subjects, do your stats and end up with a big pile of useless goo because your methodology wasn’t well thought out. It sucks. And it happens way more than it needs to, mainly because a lot of linguistics programs don’t stress rigorous scientific training.

OK, sermon over. Maps! I think using maps to look at language data is a great methodology! Why?

FraMauroMap
Hmm… needs more data about language. Also the rest of the continents, but who am I to judge? 
  1.  You get an end product that’s tangible and easy to read and use. People know what maps are and how to use them. Presenting linguistic data as a map rather than, say, a terabyte of detailed surveys or a thousand hours of recordings is a great way to make that same data accessible. Accessible data gets used. And isn’t that kind of the whole point?
  2. Maps are so. accurateright now. This means that maps of data aren’t  just rough approximations, they’re the best, most accurate way to display this information. Seriously, the stuff you can do with GIS is just mind blowing. (Check out this dialect map of the US. If you click on the region you’re most interested, you get additional data like field recordings, along with the precise place they were made. Super useful.)
  3. Maps are fun. Oh, come on, who doesn’t like looking at  maps? Particularly if you’re looking at a region you’re familiar with. See, here’s my high school, and the hay field we rented three years ago. Oh, and there’s my friend’s house! I didn’t realize they were so close to the highway. Add a second layer of information and BOOM, instant learning.

The studies

Two of the studies I came across were actually based on Twitter data. Twitter’s an amazing resource for studying linguistics because you have this enormous data set you can just use without having to get consent forms from every single person. So nice. Plus, because all tweets are archived, in the Library of Congress if nowhere else, other researchers can go back and verify things really easily.

This study looks at how novel slang expressions spread across the US. It hasn’t actually been published yet, so I don’t have the map itself, but they do talk about some interesting tidbits. For example: the places most likely to spawn new successful slang are urban centers with a high African American population.

The second Twitter study is based in London and looked at the different languages Londoners tweet in and did have a map:

Click for link to author’s blog post.

Interesting, huh? You can really get a good idea of the linguistic landscape of London. Although there were some potential methodological problems with this study, I still think it’s a great way to present this data.

The third study I came across is one that’s actually here at the University of Washington. This one is interesting because it kind of goes the other way. Basically, the researchers has respondents indicate areas on a map of Washington where they thought  language communities existed and then had them describe them.  So what you end up with is sort of a representation of the social ideas of what language is like in various parts of Washington state. Like so:

Click for link to study site.

There are lots more interesting maps on the study site, each of which shows some different perception of language use in Washington State. (My favorite is the one that suggests that people think other people who live right next to the Canadian border sound Canadian.)

So these are just a couple of the ways in which people are using maps to look at language data. I hope it’s a trend that continues.